
Figure 3. qRT-PCR analysis of SAUR76 expression.
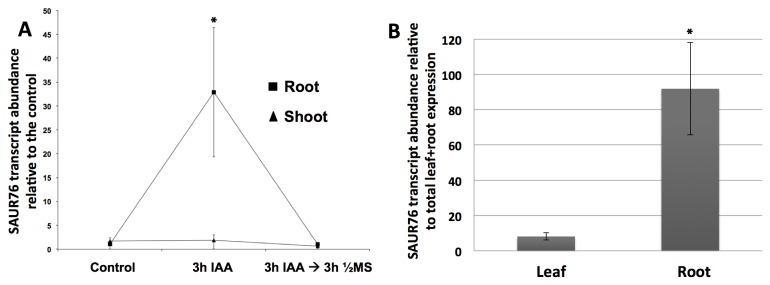
A) SAUR76 transcript abundance in roots and leaves of control plants, plants treated with 5 μM ACC during 3 hours and of plants that were 3h treated with ACC and re-transferred to control medium for 3 hours. The transcript abundance is expressed relative to the level in control roots or shoots depending on the plant part studied (n=2 replicates, including ≥ 20 roots or ≥ 10 leaves, mean ±an l. B) SAUR76 transcript abundance in leaves and roots relative to the total expression in roots and leaves together (n=7, mean ± SE). The asterisks points to a statistical significance towards the control expression level (A) or expression in the leaves (B).