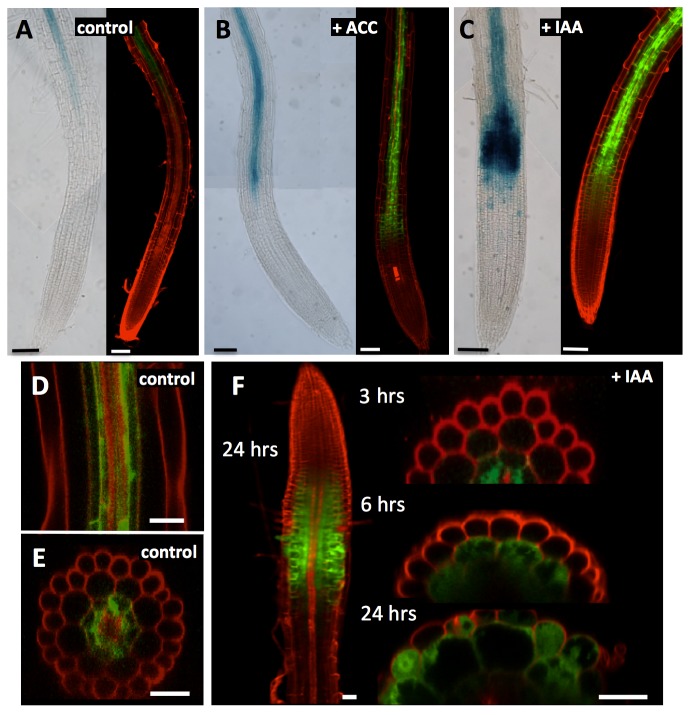
Figure 4. Expression analysis of SAUR76 in control roots and roots treated with ACC and IAA.
A) Expression of SAUR76 seen in promoter::GUS (left) and promoter::GFP lines (right) in control conditions. B) Expression of SAUR76 in roots after 3 h treatment with 5μM ACC or C) 5μM IAA. D) Confocal mid-plane longitudinal and E) transverse section in the differentiation zone of untreated promotor::GFP roots and F) after 3, 6 and 24 hrs treatment with 5μM IAA. Scale bars are 100μm in A-C, 30μm in D-E and 20 μm in F.

