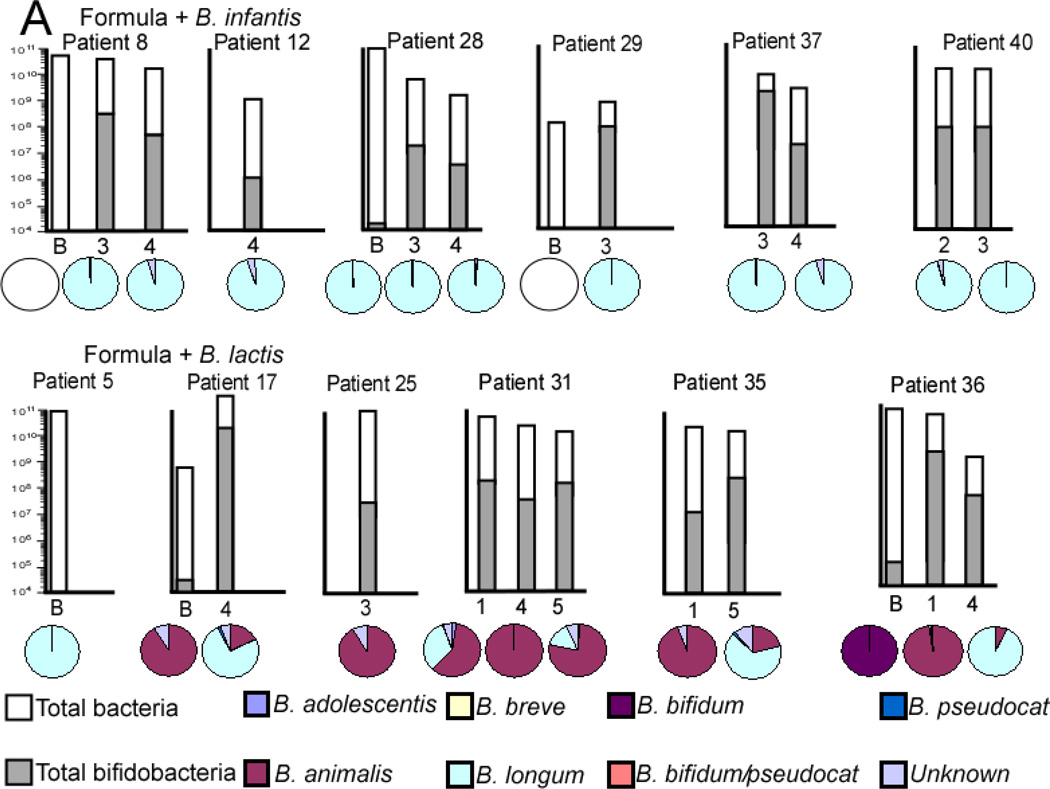
Figure 10.
qPCR analysis of total bacteria (white bars) and Bifidobacteria (gray bars) and Bifidobacteria-specific TRFLP (pie charts) for selected specimens in each group. The Y axis for total bacteria is a logarithmic scale and represents copies 16S rRNA gene per g stool. The pie charts represent percentages of total Bifidobacteria not percentages of total bacteria.

