Figure 2.
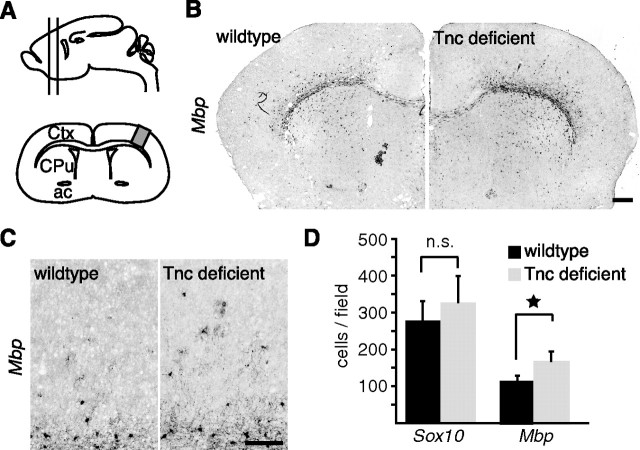
Accelerated Mbp expression in forebrains of Tnc mutant mice. A, Schematic drawing of the forebrain region studied. The analysis was confined to the boxed cortical region on frontal sections (lower drawing) that contained the anterior commissure as a landmark. B, C, Photomicrographs of in situ hybridizations for Mbp in P10 wild-type and knock-out littermates are shown. The pictures show stronger reactivity for Mbp in the Tnc-deficient brain. D, The quantification of cells that express Mbp or Sox10 in the dorsal cortex between corpus callosum and pial surface shows that the fraction of Mbp-positive cells is significantly higher in the Tnc knock-outs (*p = 0.03; n = 5). The quantification of Sox10-positive cells did not show a significant increase (p = 0.6; n = 4). Data in are expressed as mean ± SEM. Scale bars, 200 μm. Ctx, Cortex; CPu, caudate–putamen; ac, anterior commissure; n.s., not significant.

