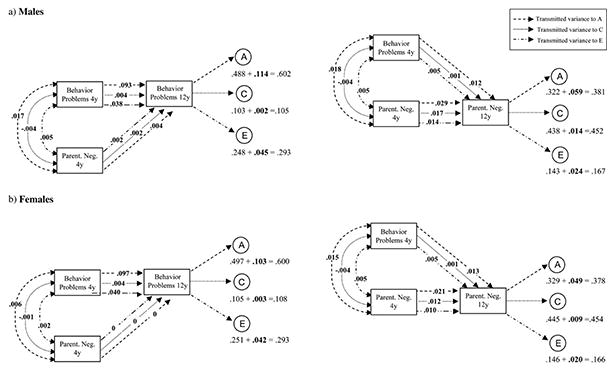
Figure 3.

Diagrams presenting the breakdown of the total genetic (A), common (C), and unique environmental (E) influences of behavior problems and parental negativity at age 12 in (a) males and (b) females. These values do not represent path estimates, but instead represent the different proportions of transmitted A (dashed line), C, and E variance. Total A, C, and E variances are decomposed into time-specific and transmitted (in bold) variances. For example, total genetic influences of behavior problems at age 12 in males equals .602. This value is the sum of the time-specific (.488) and transmitted variance (.114). Following the dashed line, genetic transmitted variance to behavior problems at age 12 can be tracked, specifically .114 equals the sum of the genetic transmitted variance from the same phenotype at age 4 (.093), parental negativityat age 4 (.004), and their covariance (.017)(.093 + .004 + .017 =.114). Common and unique environmental transmitted variance can also be tracked following the dotted line and the dotted and dashed line, respectively.
