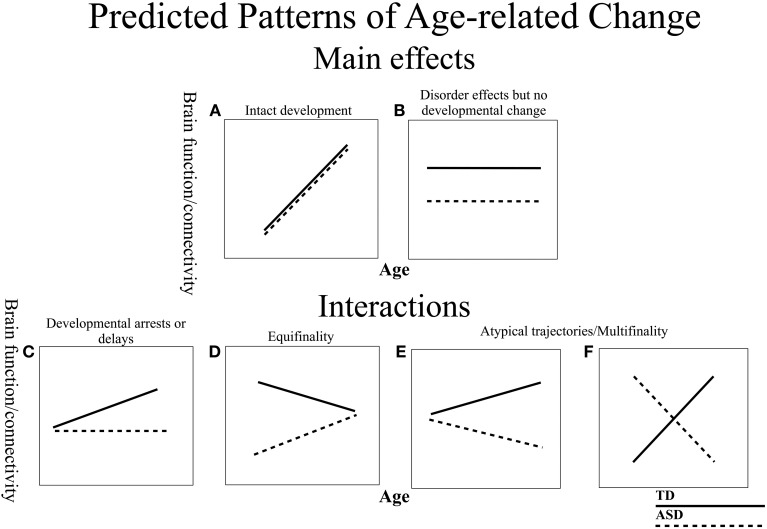
Figure 1.
Schematic of predicted models of age-related change in ASD and TD. The ASD group is depicted with dashed lines and the TD with solid lines. (A) Both groups display age-related change, but do not differ in trajectories suggesting intact development in ASD. (B) Stable disorder effects that persist over development, with no age-related changes. (C) TD group shows age-related change, but ASD group remains unchanged, suggesting a developmental arrest or delay. (D) Both groups display differential developmental trajectories that converge into adulthood (Equifinality). (E,F) Both groups display differential developmental trajectories that diverge in adulthood (Multifinality).

