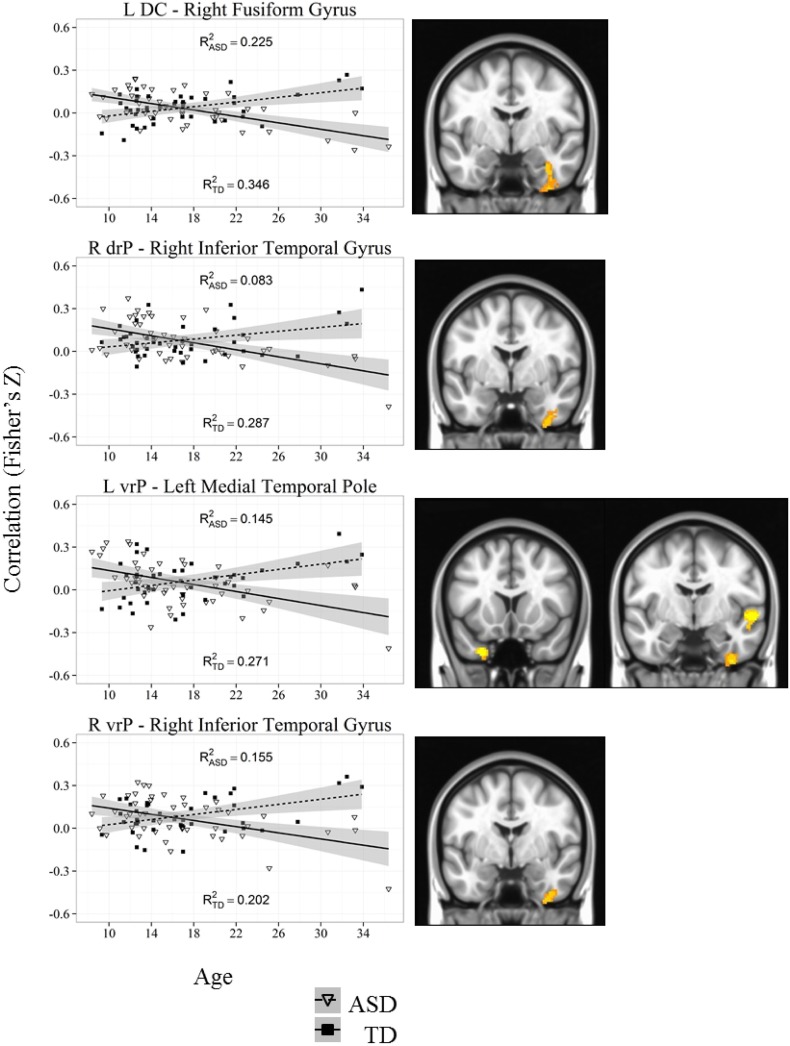
Figure 6.
Representative graph depicting most significant region that showed an age by diagnosis group interactions with caudate and putamen (DC, drP, vrP). For all analyses, we used a Monte Carlo simulation for cluster correction (voxel-wise p < 0.005, cluster-level p < 0.004 or 105 voxels) (AFNI; 3dClustSim). Z-transformed correlation coefficients are displayed on the y-axis and age in years on the x-axis of each graph. Title of each graph describes the seed region and the relevant connecting cluster. Partial R2 values of the regression lines for each group are depicted on each graph (R2ASD and R2TD). Triangles and solid lines are TD participants, squares and dashed lines are ASD participants. L, Left; R, Right; DC, Dorsal Caudate; drP, dorsal rostral Putamen; vrP, ventral rostral Putamen; TD, Typical Development; ASD, Autism Spectrum Disorder. See Table 4 for cluster coordinates. See Figure S5 for all graphs.

