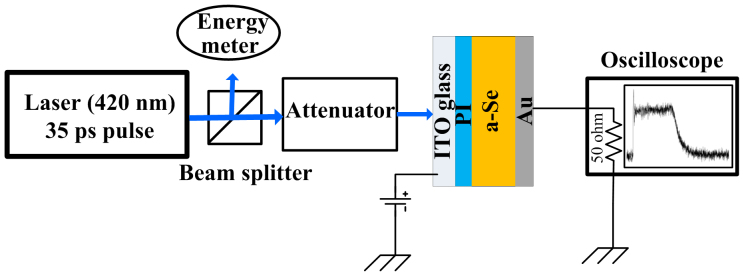
Figure 3. Schematic diagram of the experimental setup for Time-of-Flight (TOF) measurements.

The device is exposed from the ITO side and the photocurrent transients are monitered at different electric fields by an oscilloscope. The electric field within the device is created by positively biasing the ITO layer.
