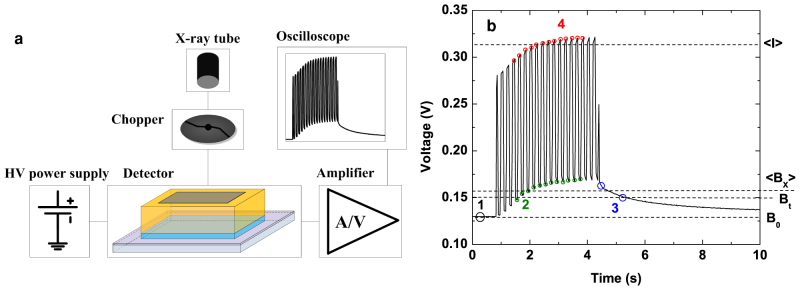
Figure 6. Detector performance characterization using X-ray exposures.

(a) Schematic diagram of the experimental setup for X-ray temporal performance. (b) A measured oscilloscope output using an X-ray pulse of 3.6 s for Au (+) biasing. Numbered regions refer to the following. 1 (B0): dark current measured before X-ray exposure; 2: dark current value measured during X-ray exposure (with chopper) used to calculate mean dark current value (<Bx>); 3 (Bt): the dark current measured at t seconds after X-ray exposure; 4: photocurrent value measured during X-ray exposure (with chopper) used to calculate mean photocurrent value (<I>).
