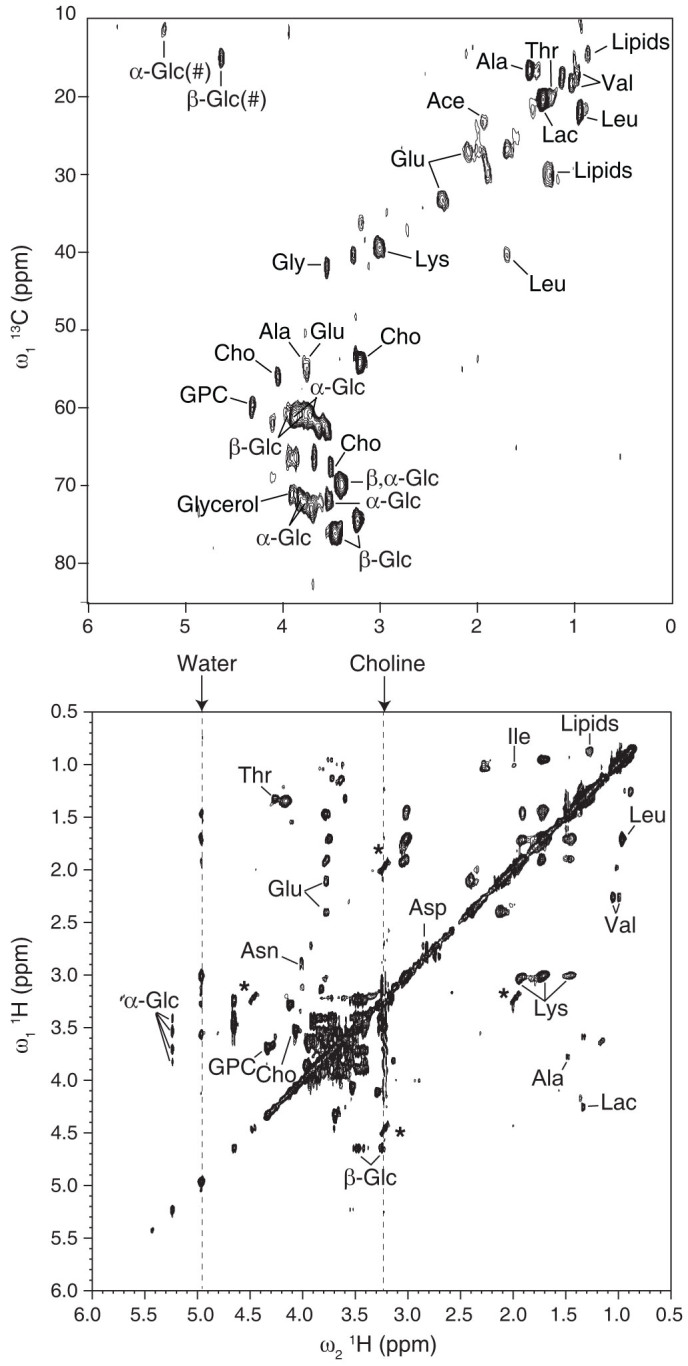
Figure 3. Aliphatic regions of the two-dimensional hetero-nuclear (1H-13C) HSQC (top) and homo-nuclear (1H-1H) TOCSY with a rotor-synchronized DIPSI mixing time of 70 ms (bottom) HR-MAS NMR spectra obtained on intact liver tissue at 280 K and 500 Hz spinning frequency.

NMR assignments of the most significant metabolites are indicated (Ace, acetate; Ala, alanine; Asn, asparagin; Asp, aspartate, Cho, choline; α/β-Glc, α/β-D-glucose, Glu, glutamate, GPC, glycerophosphocholine; Gly, glycine, Ile, isoleucine; Lac, lactate; Leu, leucine; Lys, lysine; Thr, threonine; Val, valine). 1H frequencies of water and choline resonances are indicated by arrows at the top of the spectrum and materialized by dashed lines in the spectrum. The symbol # designates folded cross-peaks. Asterisks indicate residual SSB originating from of intense choline and GPC signals at 3.21 and 3.23 ppm, respectively. The HSQC and TOCSY spectra were recorded in 26 and 30 hours, respectively.
