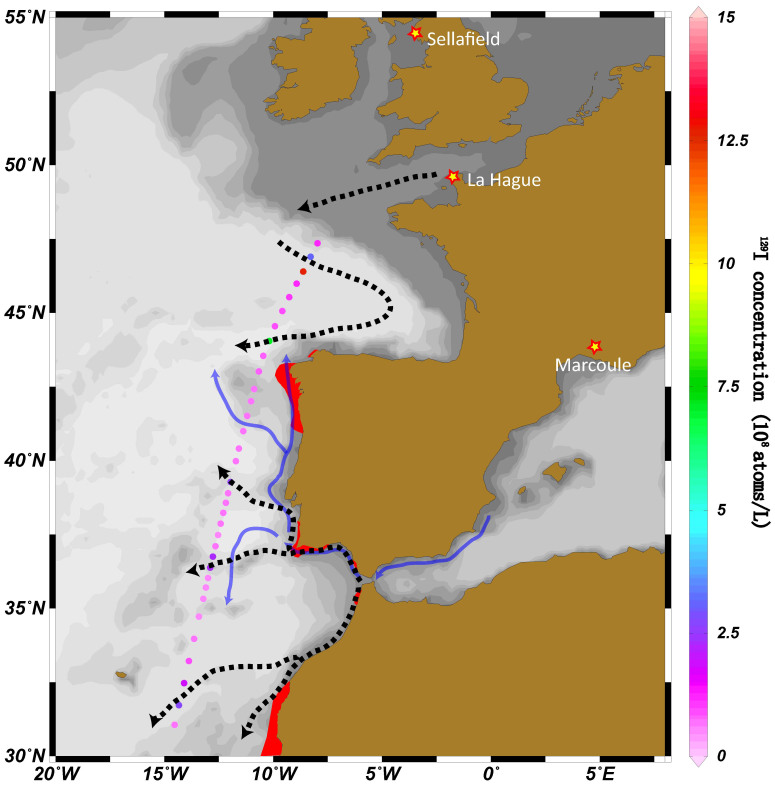
Figure 4. Concentrations of 129I (108 atoms/L) along the transect and suggested surface 129I pathways from the English Channel and the Strait of Gibraltar (dashed arrows).
Red regions represent major coastal upwelling and solid blue lines show the spread pathways of deep Mediterranean water. Major nuclear reprocessing facilities (NRFs) are marked as stars. The original map was constructed by a free software Ocean Data View (ODV 4.5.3).

