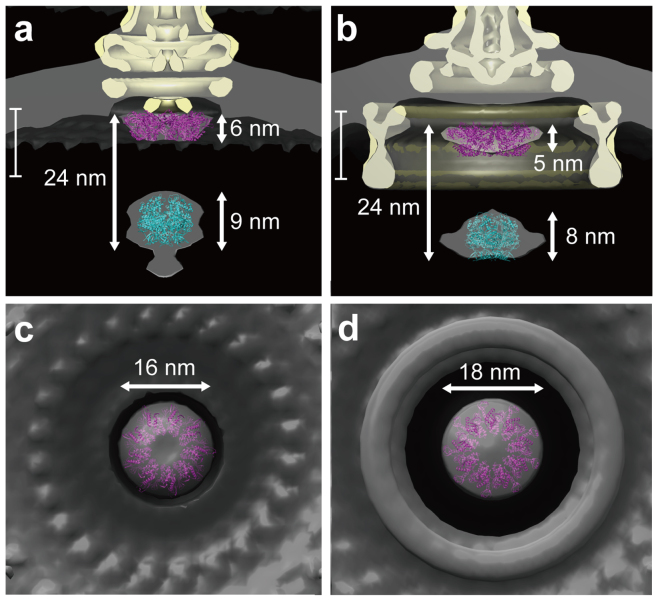
Figure 5. Superposition of cryoEM density maps of isolated NC and FBB on and docking of the atomic models of MxiAC, FlhAC and FliI into the density maps of in situ NC and FBB.
Magnified views of the membrane and cytoplasmic portions of NC (a,c) and FBB (b,d). Side views of half-cut section (a,b) and bottom views (c,d) of in situ (grey) and isolated (beige) structures are shown in solid surface representation. The ribbon models in purple are the nonameric rings of Shigella MxiAC (PDB ID 4A5P; ref. 16) (A, C) and FlhAC17 (b,d) fitted into the wing-like disc densities, and those in cyan are the hexameric ring model of FliI ATPase18 fitted into the globular densities (a,b).

