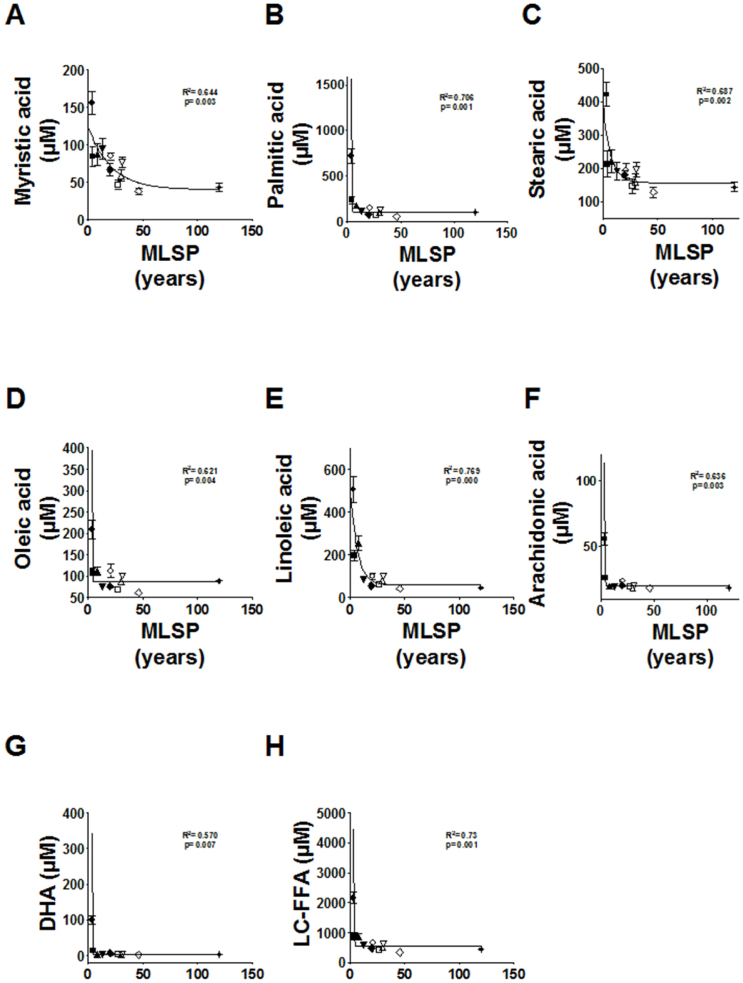
Figure 2. Relationship between maximum longevity (MLSP) and long-chain free fatty acid (LC-FFA) concentrations.
From A to G, for specific FFA; H, for total concentration of plasma LC-FFA. Curve estimation (inverse mode) equation: Y = b0 + (b1/MLSP) (Myristic acid: b0 = 51.397, b1 = 95.311; Palmitic acid: b0 = 27.754, b1 = 1664.309; Stearic acid: b0 = 137.742, b1 = 699.445; Oleic acid: b0 = 70.313, b1 = 336.26; Linoleic acid: b0 = 25.156, b1 = 1284.553; Arachidonic acid: b0 = 15.920, b1 = 91.108; Docosahexaenoic acid (DHA): b0 = −7.023, b1 = 230.665; LC-FFA: b0 = 319.938, b1 = 4609.232). N × group: 9–15 animals. Values are means ± SEM.

