
Figure 4.
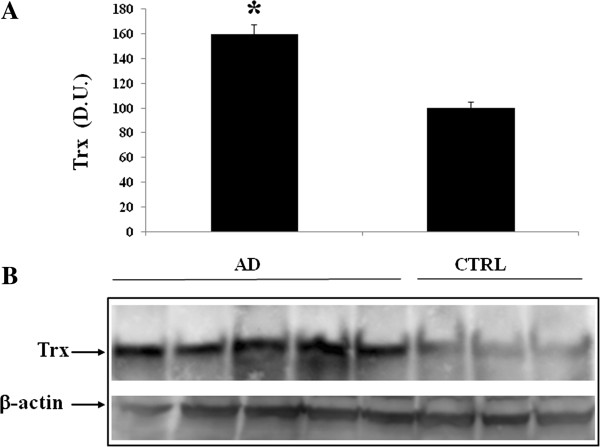
Thioredoxin (Trx) protein levels in lymphocytes of AD and control subjects. Samples from control and AD subjects were assayed for Trx expression by Western blot. A) Densitometric evaluation: the bar graph shows the values are expressed as mean standard error of mean of 3 independent analyses. P ≤ 0.05 vs control. B) A representative immunoblot is shown. β-actin has been used as loading control. D.U., densitometric units; AD, Alzheimer’s disease; CTRL, control.