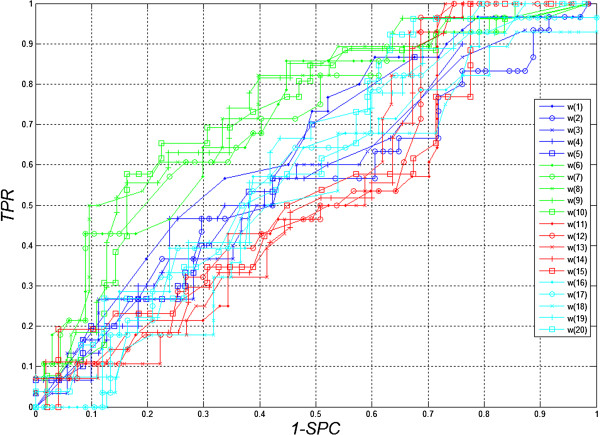
Figure 6.

ROC Chart (Receiver Operating Characteristic). The graphs show the impact of threshold values for individual features w(1) to w(20) for the different imaging types Z1, Z2, Z3. A negligible impact of the features w(11) and w(20) on the obtained results can be inferred here. In addition, sensitivity of features to changes in decision-making threshold values is the smallest for the feature w(11) and the highest for w(8).
