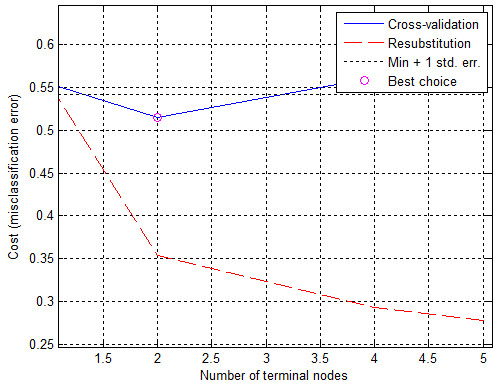
Figure 7.

The graph of the cost relationships (misclassification error) as a function of stratified cross-validation and resubstitution. The blue shows the cross-validation error. The best choice, the place of decision tree trimming is circled as the closest cut below the minimum error value plus a mean square error (min + 1 std. err).
