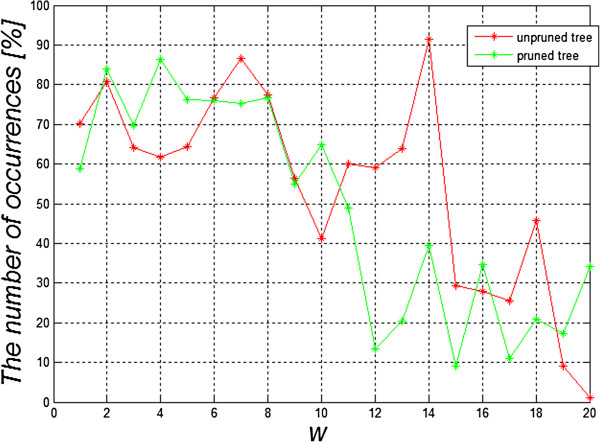
Figure 8.

The graph of occurrence frequency of individual features w(1) to w(20) for the complete decision tree and the cut one for the first top 1′000 results. The graph shows that the highest occurrence concerns the feature w(14) for the complete decision tree and the feature w(4) for the cut decision tree. The occurrence frequency of the features corresponds with the results shown in Tables 2 and 3.
