Figure 6.
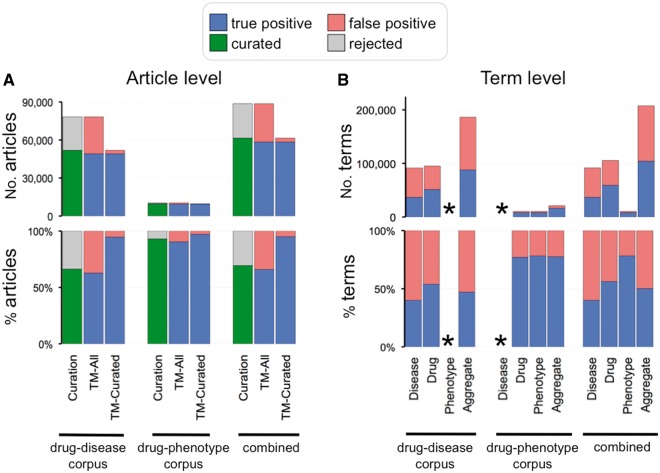
Curation and text-mining metrics. (A) Curation and text-mining metrics at the article level. The top graph shows the number of articles and the bottom graph shows the percentage for each corpus (drug–disease, drug–phenotype and combined). Curation metrics are measured by the number of curated articles (green bars) vs. number of rejected articles (gray bars). Text-mining metrics are measured by true positives (blue bars) vs. false positives (red bars) and measured against all the articles in the corpus (TM-All) as well as against solely the curated articles in the corpus (TM-Curated). (B) Text-mining metrics at the term level. The top graph shows the number of text-mined terms and the bottom graph shows the percentage for each term category (disease, drug, phenotype and aggregate of all the text-mined terms) from each corpus. Phenotype terms were not text mined for the drug–disease corpus and disease terms were not text mined for the drug–phenotype corpus (indicated by asterisks).

