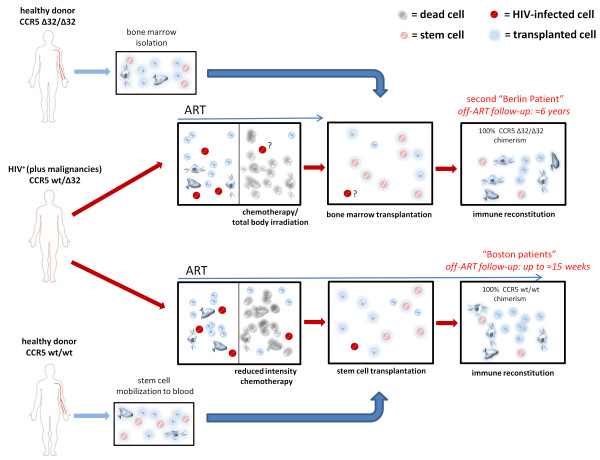
Figure 2.
Schematic representation of the therapeutic interventions received by the second “Berlin patient” and the “Boston patients”. Although the second “Berlin patient” had received two stem cell transplants, only one is shown for clarity purposes. Note that the length of the arrows indicating the period under ART is meant to provide a qualitative comparison between the ART and transplantation schedules and is not in scale.

