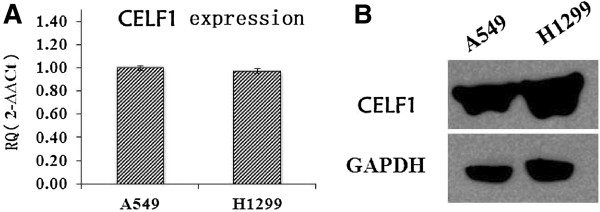
Figure 2.

Expression levels of CELF1 in lung cancer cells. (A). Expression levels of CELF1 in A549 and H1299 cells analyzed by real time PCR. (B). Protein expression levels of CELF1 in A549 and H1299 cells analyzed by western blotting. The values represents the mean from three independent experiments; bars represent SD. *P < 0.05, **P < 0.01 compared with controls.
