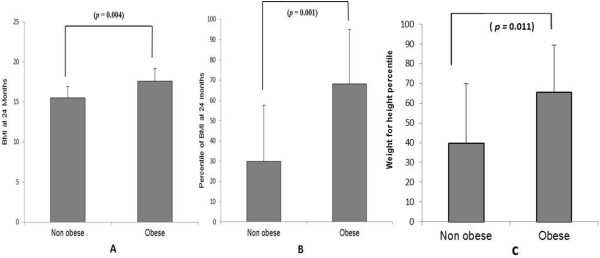
Figure 2.

Obese adolescent showed significantly higher weight at the age of 24 months as compared with peers who were not obese later in childhood. Graph (A) is a comparison of Body Mass Index (BMI), graph (B) is a comparison of percentile of BMIs and graph (C) is a comparison of weight for height percentile.
