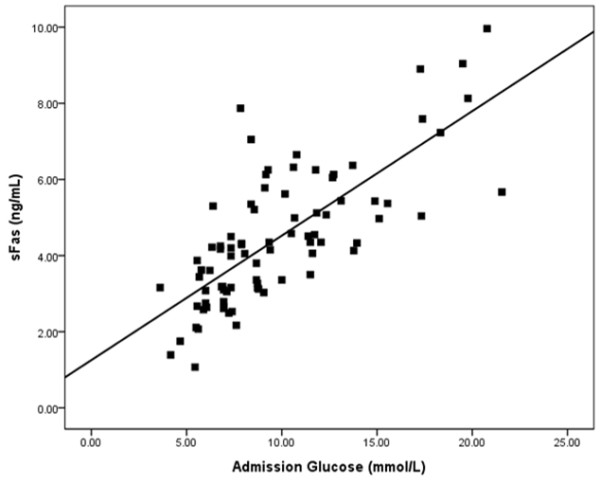
Figure 2.

Correlation between the admission glucose level and the sFas level. We found that sFas levels increased in accordance with improvement in the admission glucose level. The correlation coefficient R is 0.747, the R2 is 0.559, with a regression line equation of Y = 1.225 + 0.327X (P < 0.05).
