
Figure 2.
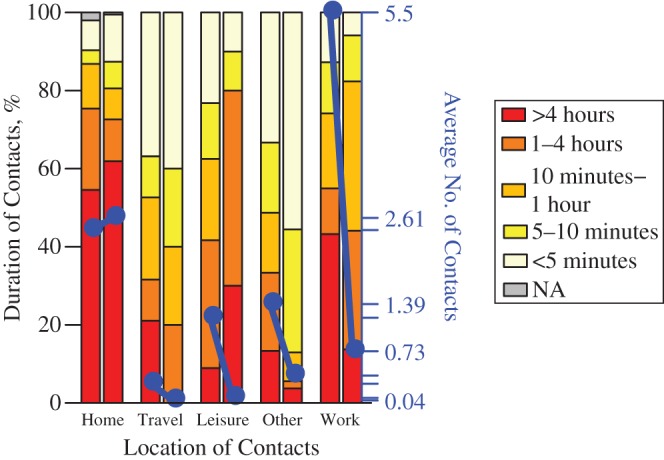
Numbers and durations of encounters in different social settings during the 2009 A/H1N1pdm influenza epidemic for asymptomatic and symptomatic study participants in the paired data set (n = 140), England, 2009–2010. The blue points show the average number of encounters in each setting (right-hand axis), and the colors show the distribution of encounter durations (left-hand axis). For each pair of bars, the left-hand bar represents contacts made when asymptomatic, and the right-hand bar represents contacts made when symptomatic. In every location except home, a drop in the average number of contacts can be observed. NA, not applicable.