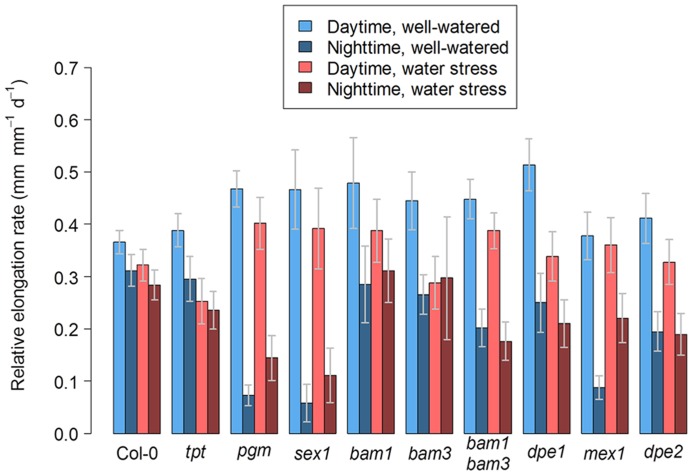
FIGURE 4.
Day/night leaf growth in Arabidopsis mutants affected in carbon metabolism and grown in well-watered conditions or under soil water stress. The bar plot shows the daytime and nighttime growth averaged for the days 4, 5, and 6 following emergence of the sixth leaf under well-watered conditions or under moderate soil water stress. Error bars are 95% confidence intervals.

