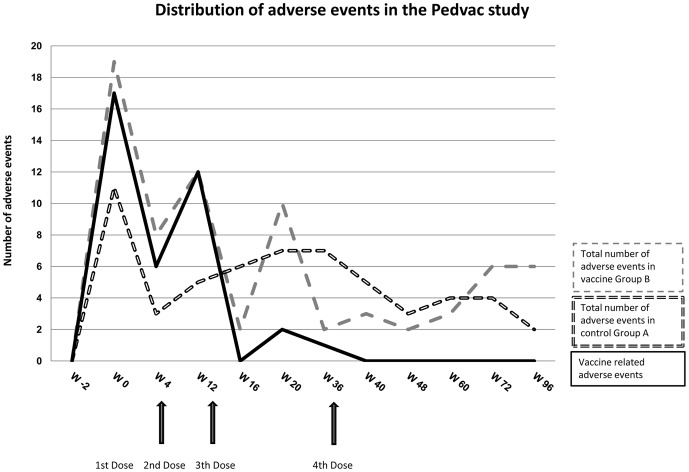
Figure 2. Safety Profile of the PEDVAC trial: distribution of adverse events during the 96 weeks follow-up of the study.
The black dashed line shows total number of solicited and unsolicited adverse events in control Group A. The gray dashed line indicates total number of solicited and unsolicited adverse events in vaccine Group B, while the black solid line indicates all local and systemic adverse events which were vaccine related. Black arrows show vaccinations (weeks 0, 4, 12 and 36).

