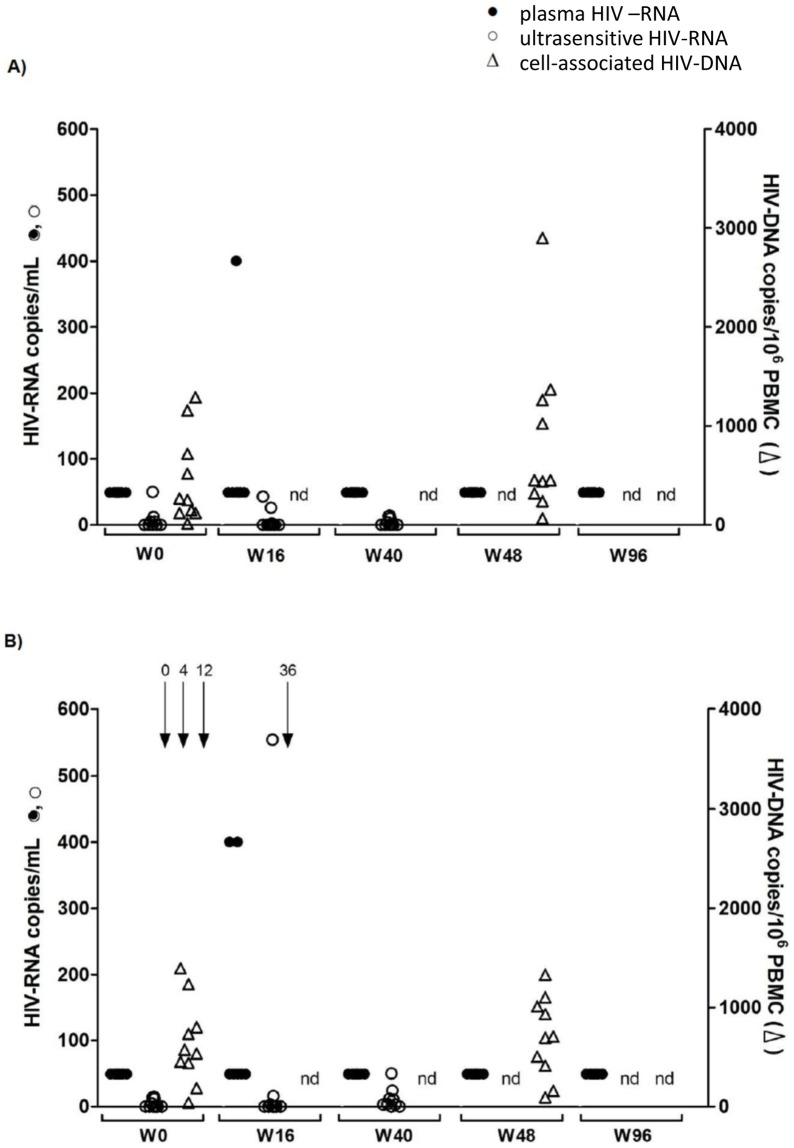
Figure 3. Viral dynamics during the vaccination schedule for the control Group A (n = 10) (A) and vaccine Group B (n = 10) (B).
HIV-RNA with a limit of detection of 50 copies/ml is shown as black dots, HIV-RNA ultrasensitive assay with a limit of detection of 1 copy/ml plasma is shown as circles and cell associated HIV-DNA of PBMC shown as triangles indicating number of total HIV-proviral DNA copies/106 PBMC. Black arrows show vaccinations (weeks 0, 4, 12 and 36).

