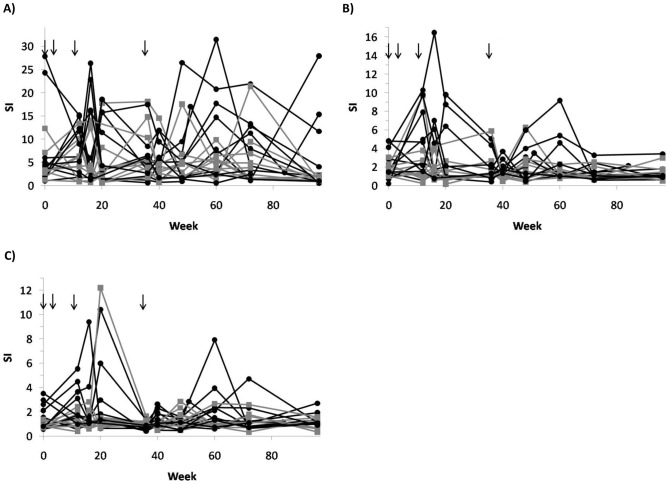
Figure 4. Lymphoproliferative responses are shown as Stimulation Index (SI) to virion HIV-1 MN (A), recombinant Gag p24 (B) and recombinant RT (C) viral antigens among vaccinated (n = 10; black dots and lines) and controls (n = 10; grey squares and lines).
Black arrows show vaccinations (weeks 0, 4, 12 and 36).

