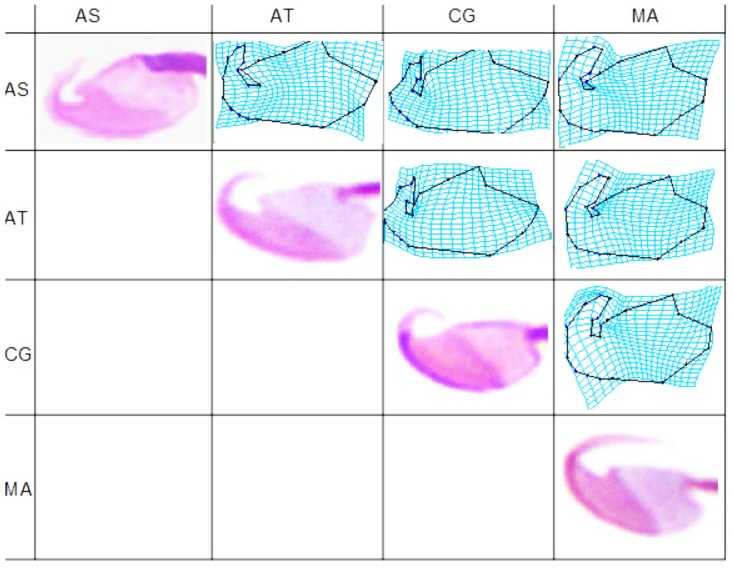
Figure 5. Sperm head mean deformation patterns after standardization to common regularity.
TPS deformation grids illustrate mean shape differences by deforming one species average into that of another species. AS, Arvicola sapidus; AT, Arvicola terrestris; CG, Clethrionomys glareolus and MA, Microtus arvalis.

