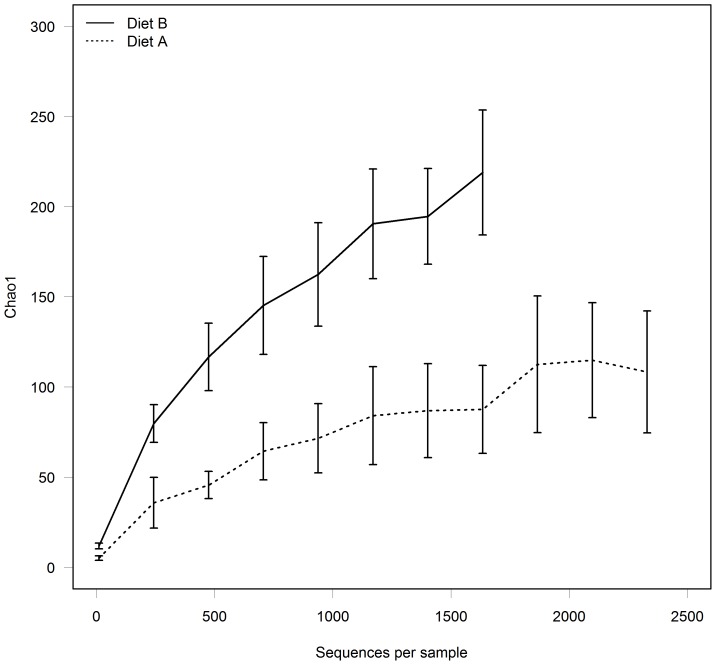
Figure 2. The effects of Diet A or Diet B on faecal microbial diversity in pregnant queens (Felis catus).
The rarefaction curves based on the Chao1 diversity index (at 97% sequence identity cut-off) indicate that faecal bacterial communities of cats fed Diet A (---; n = 3 cats) were less diverse than those of cats fed Diet B (–; n = 4 cats). Data are reported as means ± SEM.

