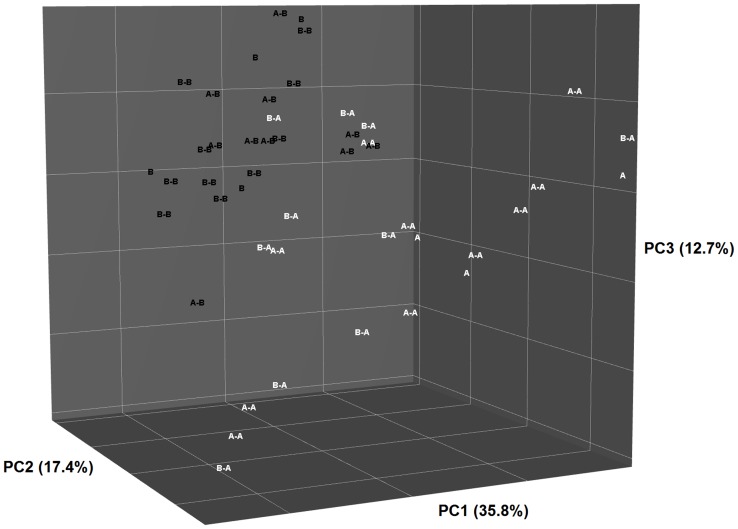
Figure 4. Principal Coordinate Analysis plot of weighted Unifrac phylogenetic distances showing the similarities between bacterial communities of queens fed Diet A or Diet B and their offspring fed Diet A (B-A or A-A) or Diet B (B-B or A-B) post-weaning.
Percentage of variation captured by each component indicated on axes.

