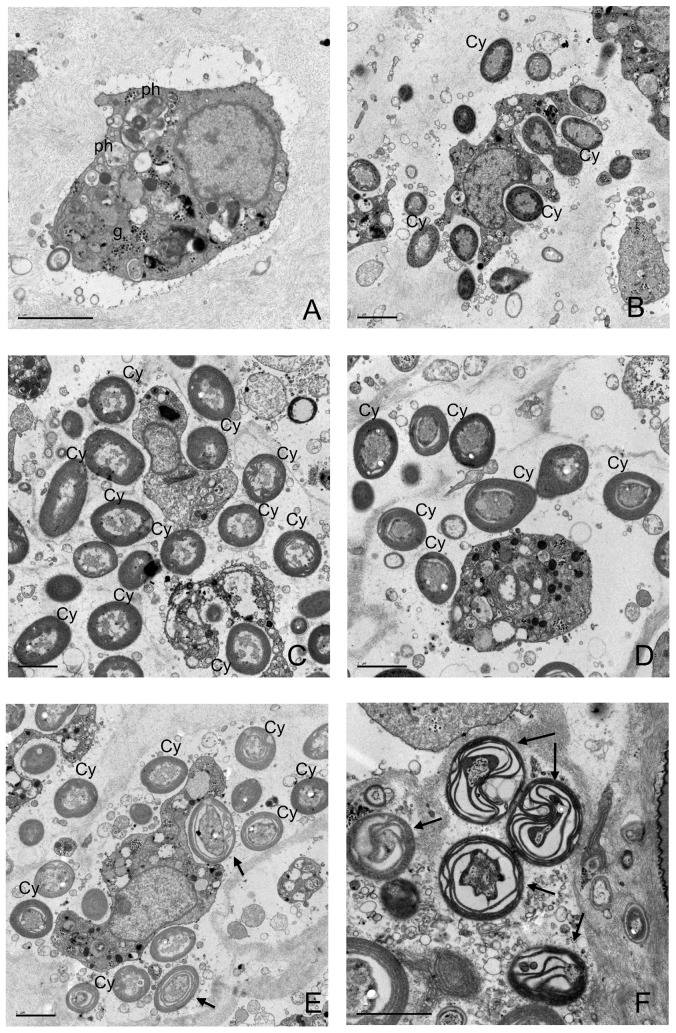
Figure 2. Electron micrographs of I. fasciculata bacteria at the end of the experiment.
A) Sponge cell in sample from control treatment, containing several phagosomes (ph) and glycogen granules (g). Sponge cells surrounded by multiple Cyanobacteria (Cy) and heterotrophic bacteria in the mesohyl of sponges from control treatment (B), NH (25°C, non-filtered seawater) treatment (C) and FE (13°C, filtered seawater) treatment (D). Micrographs of a sponge from FH (25°C, filtered seawater) treatment (E, F) showed healthy Cyanobacteria (Cy) and Cyanobacteria under different stages of degradation (arrows) within the mesohyl. Scale bars represent 2 µm.

