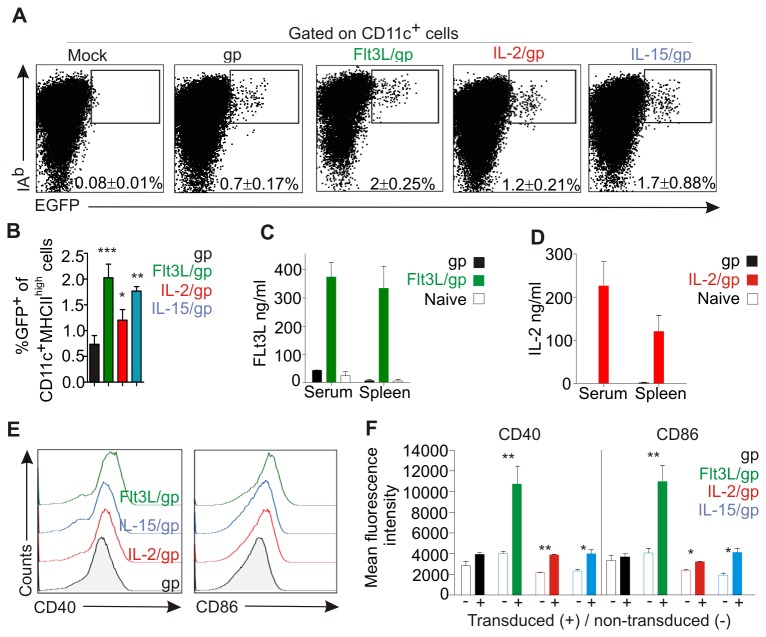
Figure 2. In vivo maturation of DCs following vaccination with coronavirus vectors.
B6 mice were i.v. immunized with 106 pfu of the indicated viral vectors or left untreated (mock). (A, B) Transduction of DCs as assessed by EGFP expression. Spleens were collected after 24 h, digested with collagenase and low-density cells were analyzed by flow cytometry. Values in dot plots (A) and bar graph (B) show the mean percentage ± SEM of EGFP+IAbhigh cells gated on CD11c+ cells. Data from two independent experiments with three mice per group (n=6). (C, D) Cytokine concentration in serum and spleen homogenates at 24 h post immunization with Flt3L (C) and IL-2 (D) vectors. Pooled data from three independent experiments with three mice per group (mean ±SEM, n=9). (E) Representative histograms showing expression of the DC maturation markers CD40 and CD86 on EGFP+CD11c+ cells transduced with the indicated vectors. (F) Mean fluorescence values ±SEM (n=9) of CD40 and CD86 expression in transduced EGFP+CD11c+ cells (+) and non-transduced EGFP+CD11c- cells (-) cells (*, p< 0.05; **, p< 0.01).

