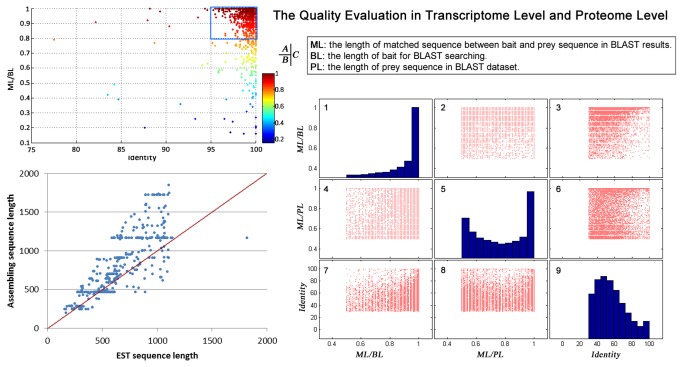
Figure 3. Statistical analysis of BLAST searches.
A) Dot plot of ML/BL vs. identity of the BLAST queries, which searched against known spider EST datasets with assembled cDNA sequences (see methods). B) Length distribution of transcripts shared by the de novo assembly and EST sequencing datasets. C) Statistical analysis of protein homologues identified by a BLAST search against the Uniprot database performed with all translated protein sequences. Figures C1, C5 and C9 are bar charts for ML/BL, ML/PL and identity distribution. Other dot plots represent the pairwise correlations among them.

