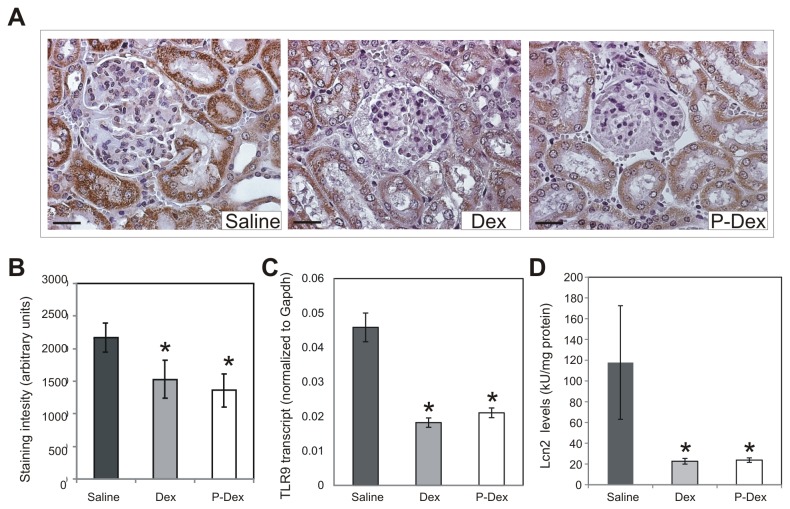
Figure 4. Impact of treatment on tubulointerstitial inflammation and injury in (NZB × NZW)F1 mice.
(A), Representative images of immunohistochemical staining of kidney sections from mice in the saline (n=13), Dex (n=13), and P-Dex (n=9) treatment groups are shown. Sections were stained with an anti-TLR9 antibody (brown) and counterstained with hematoxylin (blue). (B), Quantification of TLR9 staining is illustrated. (C), TLR9 transcript levels in the kidney were measured by quantitative RT-PCR. For the saline group, frozen kidneys were available for RNA extraction only from the 6 mice that survived until the 14-week time point. (D), Levels of LCN2 were measured in kidney lysates by ELISA. For the saline group, frozen kidneys were available for preparation of protein lysates only from the 6 mice that survived until the 14-week time point. Scale bars: 25 μm; the asterisk (*) indicates a statistically significant difference (P < 0.05) from the saline control group.

