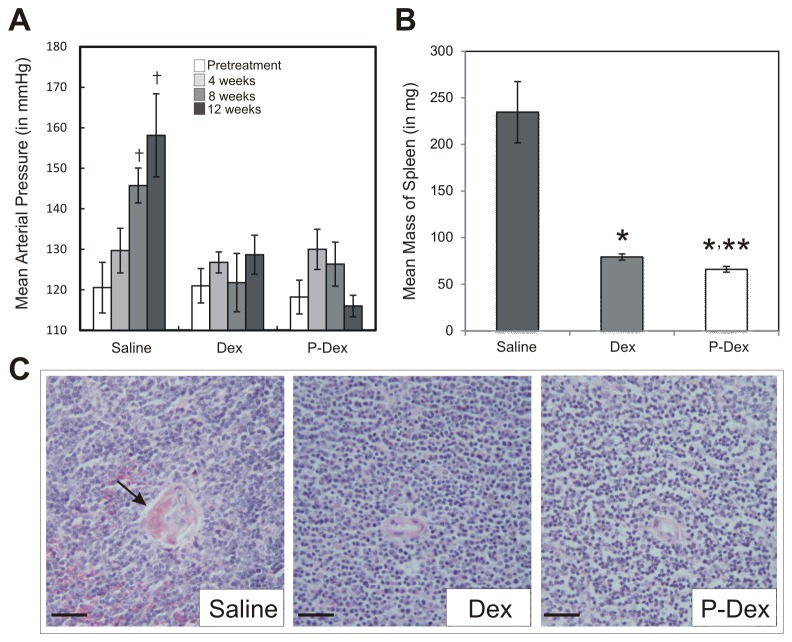
Figure 5. Impact of treatment on hypertension, splenomegaly and vasculitis in (NZB × NZW)F1 mice.
(A), Mean arterial pressure was measured at pretreatment, 4-week, 8-week, 12 week time points via tail-cuff method. For the saline group, measurements were obtained only for the subset of mice surviving at each time point: 12 mice at 4-week time point; 11 mice at 8-week time point; 9 mice at 12-week time point (B), Spleen mass was determined at the time of sacrifice in each mouse. (C), A representative hematoxylin and eosin stained histological section illustrating a splenic vessel from each treatment group is provided. The arrow indicates perivascular fibrin deposits indicative of vasculitis. Scale bars: 50 μm; the asterisk (*) indicates a statistically significant difference (P < 0.05) from the saline control group. The double asterisk (**) indicates a statistically significant difference (P < 0.05) from the Dex group. The dagger (†) indicates a statistically significant difference (P < 0.05) from the pretreatment time point of the same treatment group. For saline and Dex treatments, n=13; for P-Dex treatment, n=9.

