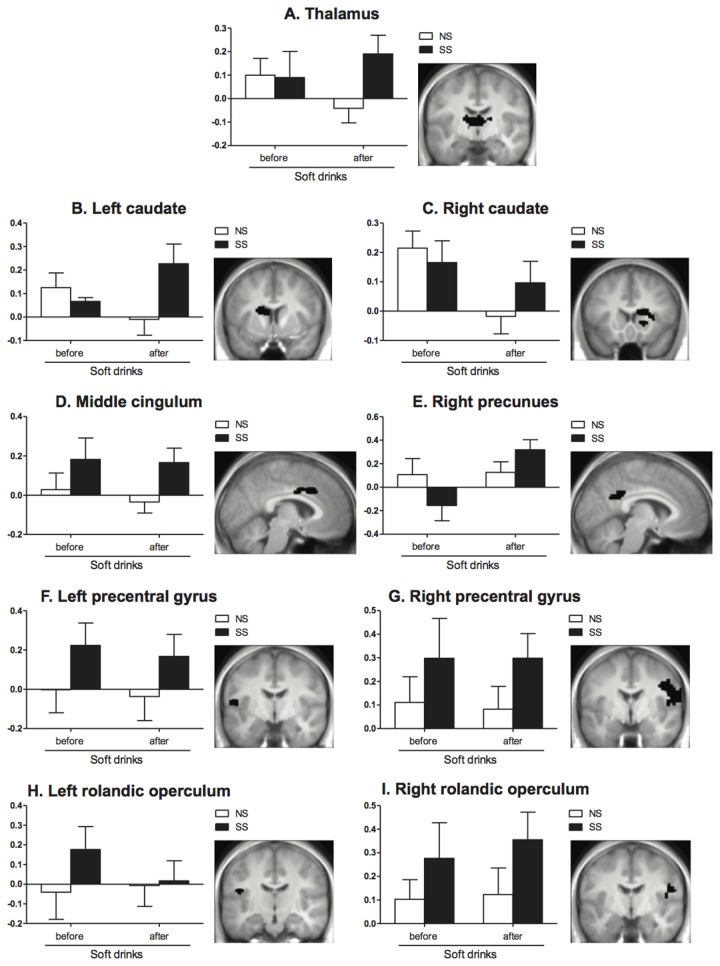
Figure 4. Mean beta value for each fROI after tasting the NS (◻) and SS (◼) soft drinks before and after conditioning for (A) the thalamus: the main effect of sweetener type was a non-significant trend (p=0.05).
(B) the left caudate: there was a significant interaction between sweetener type and time (p<0.05): however post-hoc analyses showed that the difference between the NS and SS version after conditioning was a non-significant trend (p=0.09). (C) the right caudate: no significant differences (D) the middle cingulum: there was a significant main effect of sweetener type (p<0.05). (E) right precuneus: there was a significant interaction between sweetener type and time (p<0.05): post-hoc analyses showed that taste activation was increased for the SS soft drink after conditioning (p<0.01). (F) left precentral gyrus: there was a significant main effect of sweetener type (p<0.05). (G) right precentral gyrus: there was a significant main effect of sweetener type (p<0.05). (H) left rolandic operculum: no significant differences (I) right rolandic operculum: there was a significant main effect of sweetener type (p<0.05). Values are means ± SEM (n=16). Analyses were performed by means of ANOVA (mixed model procedure). Next to each graph the corresponding fROI is shown in black on a representative slice of the mean anatomical MRI of all fMRI subjects.

