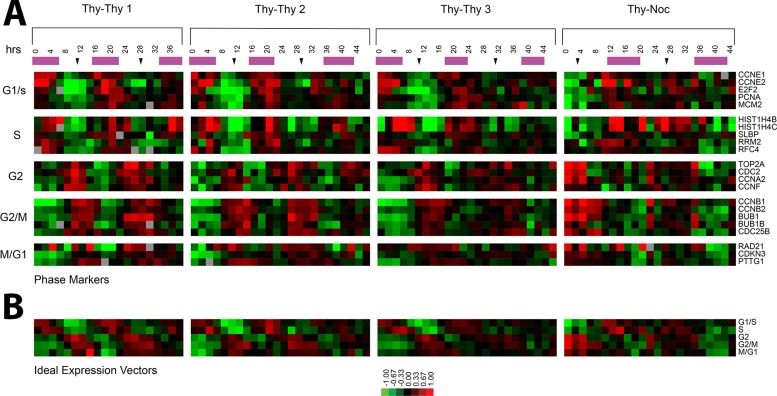
FIGURE 1:
Periodic expression of well-characterized cell cycle genes. (A) Expression profiles of known periodically expressed genes for each of the four time courses. The purple bars indicate S phase, and black arrows indicate mitosis as estimated by flow cytometry or Western blots. (B) The idealized vector for each phase is the average expression of the known genes shown in A.

