FIGURE 5:
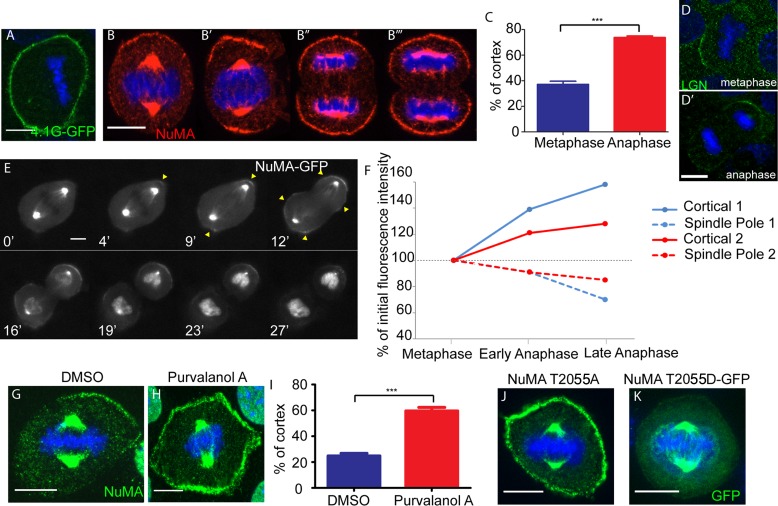
NuMA cortical expansion occurs during anaphase onset and Cdk1 inactivation. (A) 4.1G tagged to GFP was transfected into wild-type cells, and immunofluorescence analysis was performed to determine localization. (B) Immunofluorescence analysis of endogenous NuMA localization in wild-type cells during different stages of mitosis. The same exposure time was used for image acquisition of B–B′′′. (C) Quantitation of percentage of the cortex that NuMA covers in metaphase and late anaphase. Mean + SEM. n = 50 cells, p < 0.0001. (D, D′) Localization of endogenous LGN in metaphase- and anaphase-stage keratinocytes. (E) Frames taken from a time-lapse movie imaged in wide field of a dividing NuMA-GFP primary cell isolated from a K14: NuMA-GFP transgenic mouse (see Supplemental Movie S1). Time is displayed in minutes (′) at the bottom left of each frame. (F) Graph of cortical NuMA-GFP and spindle pole NuMA-GFP intensities quantified from time-lapse movies of two dividing NuMA-GFP primary cells. Cortical 1 and Spindle Pole 1 are from the same cell (shown in E), and Cortical 2 and Spindle Pole 2 are from a second cell. (G, H) Immunofluorescence analysis of endogenous NuMA in wild-type cells treated with DMSO or 100 μM purvalanol A to inhibit cyclin-dependent kinase activity. (I) Quantitation of percentage of the cortex that NuMA spans in DMSO- or purvalanol A-treated cell. Mean + SEM. n = 50, p < 0.0001. (J) A full-length NuMA construct with a T2055A mutation (to prevent phosphorylation at that residue) was transfected into wild-type cells, and immunofluorescence analysis of NuMA was performed to determine localization. (K) A full-length NuMA construct with a GFP-tagged phosphomimetic T2055D mutation was transfected into wild-type cells, and immunofluorescence analysis was performed to determine localization. Scale bars, 10 μm.

