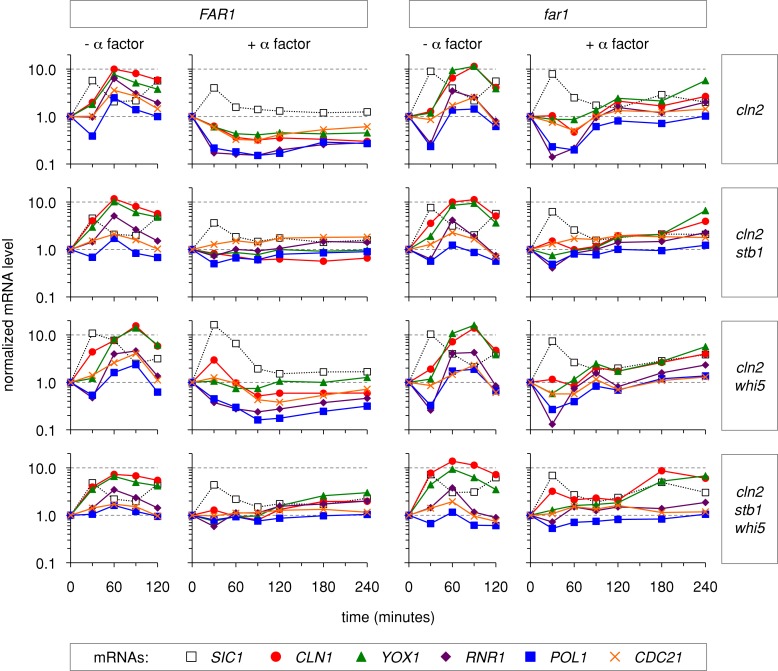
FIGURE 3:
Effects of Far1, Whi5, and Stb1 on G1/S mRNA levels. The effects of Whi5 and Stb1 on G1/S transcript levels were measured in FAR1 cln2∆ (left) and far1∆ cln2∆ (right) backgrounds. PGAL1-CDC20 strains were arrested in M phase and released with or without α factor. At 30-min intervals, mRNA levels were measured by RT-qPCR (see Materials and Methods). Five G1/S transcripts (CLN1, YOX1, RNR1, POL1, and CDC21) and one M/G1 transcript (SIC1) were monitored. mRNA levels at each time point were plotted relative to the levels present in the M-phase–arrested cultures (t = 0). The drop in G1/S transcript levels from M phase (t = 0) to G1 (t = 30 min) was unexpected because these genes are not believed to be active during mitosis; this behavior might reflect imperfect synchronization in M phase, or it might indicate that maximal repression of these genes requires nuclear localization of Swi6 and DNA binding by SBF/MBF, which are inhibited by high Cdk activity in M phase (Sidorova et al., 1995; Koch et al., 1996; Queralt and Igual, 2003; Geymonat et al., 2004). See Figure 4 for further analyses.

