FIGURE 4:
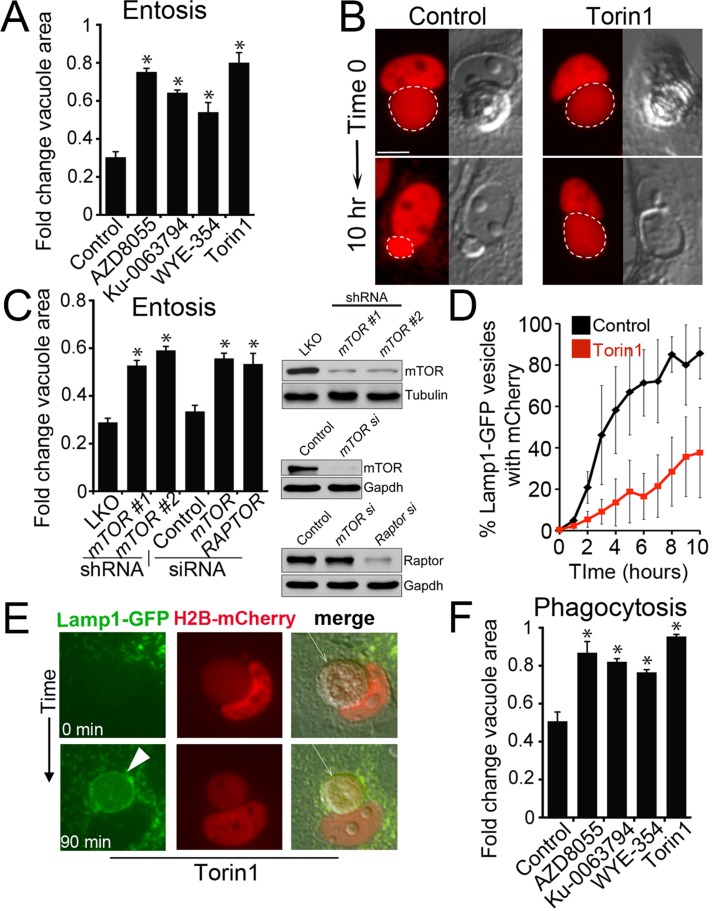
Entotic vacuole and phagosome fission is regulated by mTOR. (A) Inhibitors of mTOR slow entotic vacuole shrinkage. Fold change of vacuole area after 10 h for entotic vacuoles (MCF10A cells) measured by time-lapse microscopy of control and mTOR inhibitor–treated cells cultured in full media. Error bars, SEM for n = 3 independent experiments. Total cell number analyzed for control, n = 57; AZD8055, n = 55; Ku-0063794, n = 55; WYE-354, n = 51; Torin1, n = 55. *p < 0.02 (Student's t test). (B) mTOR inhibition slows vacuole fission. Control entotic vacuole (left) undergoes rapid shrinkage, producing mCherry-labeled puncta as corpse degrades, whereas mTOR-inhibited cell (right) is delayed for fission, leaving a large vacuole as the corpse degrades. Images show mCherry fluorescence (red) and DIC. Dashed line, entotic vacuoles marked by mCherry. Bar, 10 μm. See Supplemental Videos S7 and S8. (C) shRNA- and siRNA-mediated knockdowns of mTOR and Raptor slow entotic vacuole shrinkage. Fold change of vacuole area after 10 h for entotic vacuoles (MCF10A cells) determined by time-lapse microscopy of control and mTOR or Raptor-knockdown cells. Western blots to the right of graph show protein knockdowns. Error bars, SEM for three independent experiments. Total cell number analyzed for pLKO, n = 121; mTOR #1 shRNA, n = 89; mTOR #2 shRNA, n = 131; control (nontargeting siRNA), n = 93; mTOR siRNA, n = 87; Raptor siRNA, n = 97. *p < 0.02 (Student's t test). (D) Torin1 treatment slows the redistribution of corpse-derived mCherry from the entotic vacuole to the lysosome network of engulfing cells. Quantification of percentage of Lamp1-GFP–labeled lysosomes with mCherry fluorescence in four individual control and Torin1-treated cells, examined by confocal microscopy and quantified in every z-plane at 0.5-μm intervals through the entire cell every hour for 10 h. Error bars, SD. After 10 h Torin1-treated cells have significantly less mCherry fluorescence in lysosome networks (p < 0.01; Student's t test). (E) An entotic vacuole (arrow) in Torin1-treated cells fuses with Lamp1-GFP–labeled lysosomes (green) after PEG-initiated cell fusion. Arrowhead, Lamp1-GFP accumulation at entotic vacuole. Time indicates minutes after cell fusion. Also see Supplemental Figure S5D and Supplemental Video S9. (F) mTOR inhibition slows phagosome shrinkage in full media. Fold change of phagosome area after 2 h. Error bars, SEM for three independent experiments. Total cell number analyzed for control, n = 50, AZD8055; n = 47, Ku-0063794, n = 30; WYE-354, n = 38; Torin1, n = 54. *p < 0.02 (Student's t test).

