FIGURE 5:
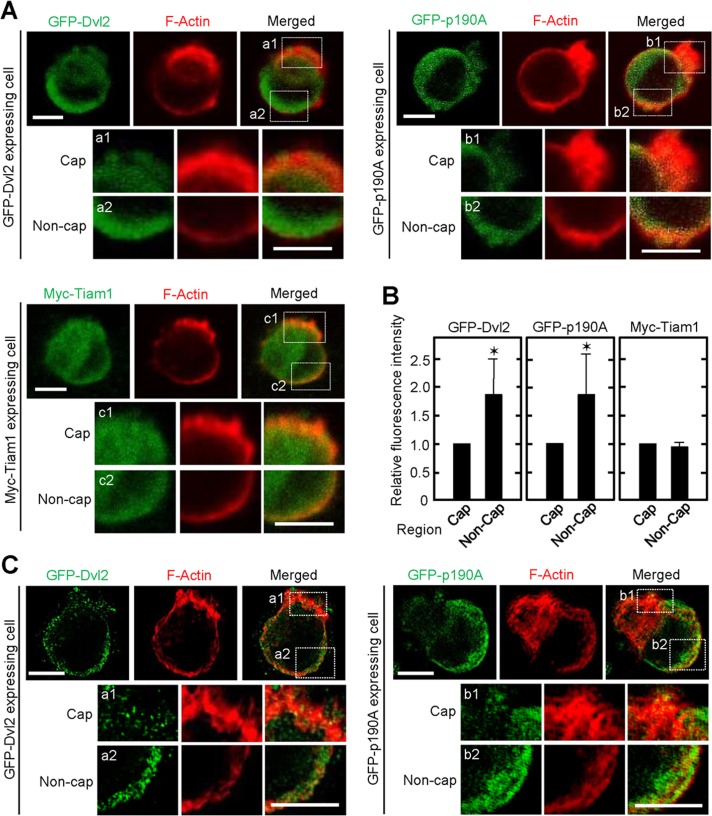
Localization of GFP-Dvl2, GFP-p190RhoGAP-A, and Myc-Tiam1. (A) IEC6 cells stably expressing GFP-Dvl2 (upper left), GFP-p190RhoGAP-A (upper right), or Myc-Tiam1 (bottom) were cultured on Matrigel for 2 h and stained for GFP (green) or Myc (green) and F-actin (red). The images are representative polarized cells. Bottom, enlarged image within dashed boxes (a1, a2, b1, b2, c1, and c2), indicating cap and noncap regions of polarized cells. (B) Average of fluorescence intensity in representative cap or noncap areas in polarized cells stably expressing GFP-Dvl2 (n = 20), GFP-p190RhoGAP-A (n = 22), or Myc-Tiam1 (n = 22) was measured, and the intensity in the noncap area was expressed relative to that in the cap area. The results are shown as means ± SD from three independent experiments. *p < 0.01. (C) Structured illumination microscopy demonstrates localization of GFP-Dvl2 (left) or GFP-p190RhoGAP-A (right) in polarized single IEC6 cells. Bottom, enlarged regions in the white boxes (a1, a2, b1, and b2). Scale bars, 5 μm (A, C).

