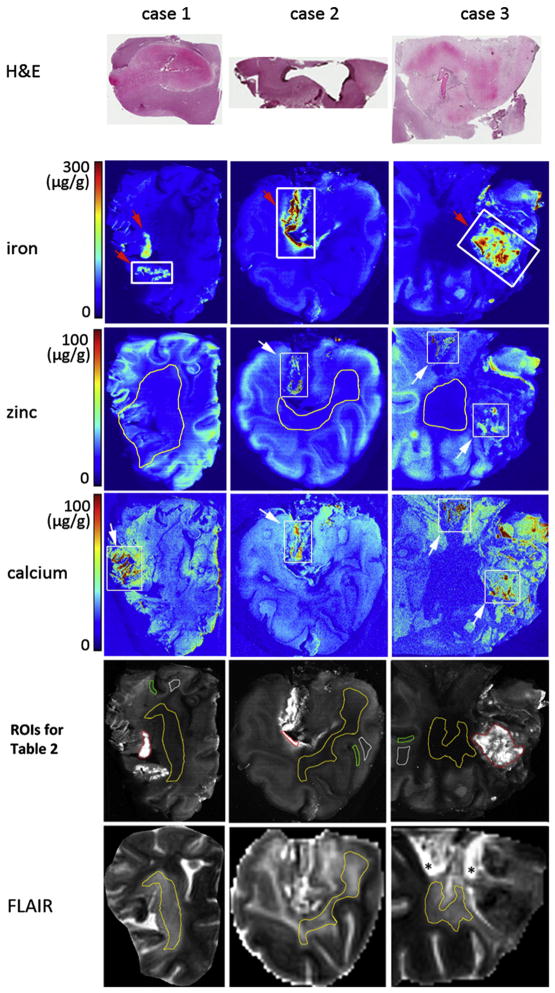
Fig. 1.
Rows 2–4 are XRF iron, zinc and calcium maps of cases 1–3 sections. Row 1 is the histology of the section closest to the hemorrhage area demarcated by the thick white rectangles drawn on the XRF iron maps. White arrow in zinc maps shows where zinc colocalizes with calcium. White arrow in calcium maps shows regions with a high concentration of calcium (>100 μg/g wet weight). The hemorrhagic lesions are pointed by red arrows in Fe maps. ROIs of hemorrhage (red), normal WM (white), GM (green) and chronic ischemic WM infarct (yellow) for the measurements in Table 2 are outlined in gray-scaled Fe map (Row 5). Row 6, the FLAIR images manually rotated (in SPIN) to be co-registered with XRF maps. Outlined regions in Row 6 indicate where the ROIs of WM infarct (Row 5) are registered from. Asterisk indicates gelatin.

