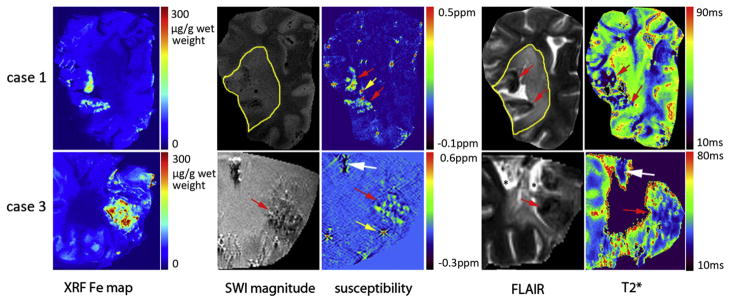
Fig. 2.

Correlation between XRF iron maps and MR imaging [SWI magnitude images (TE=18.5 ms), susceptibility maps (TE=8.2 ms), FLAIR and T2* maps] for Cases 1 and 3. The white arrows indicate possible calcification. The red arrows show the high iron regions corresponding to iron in XRF. The intense spots in the susceptibility map are artifacts caused by air bubbles (yellow arrows). Ischemic lesions are outlined in FLAIR images and SWI magnitude. Signal void in T2* maps means either it was not possible to fit T2* because of poor SNR in those locations or the T2* values in these voxels are larger than 300 ms due to the partial volume effect, partial gelatin and partial tissue in a voxel. SRS-XRF iron maps colocalize well with the higher susceptibility in susceptibility map.
