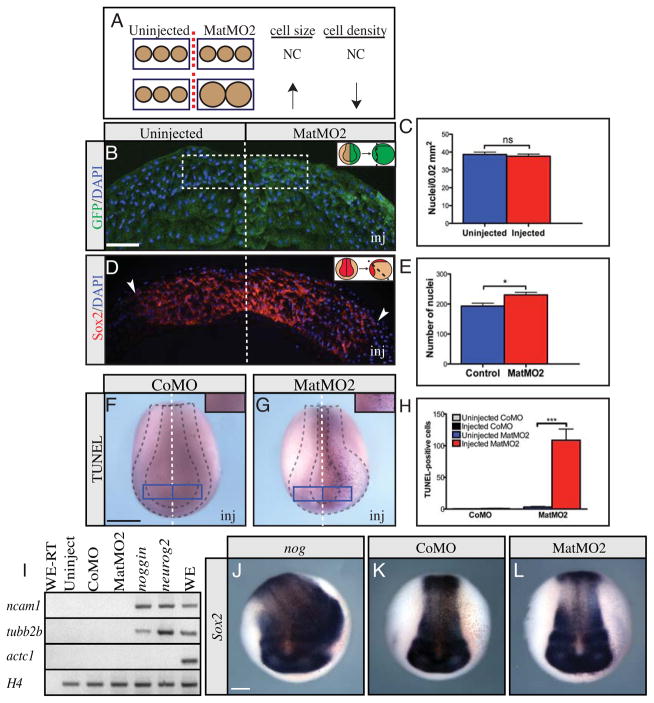
Fig. 4.
Maturin knockdown increases neural cell number without reducing cell death or inducing neural cell fate. (A–C) Neural plate cell density in MatMO2-injected embryos. (A) Diagram illustrating the predicted effect on cell density if a change in cell size is responsible for neural plate expansion. (B) The number of nuclei (Blue - DAPI) in a 100 μm by 200 μm region on either side of the midline of embryos unilaterally injected with MatMO2 and GFP cRNA (green) was determined. Inset shows how the embryos were positioned for sectioning. (C) Average number of nuclei observed in 0.02 mm2 area. (D, E) Neural plate cell number in MatMO2-injected embryos. (D) Neural plate sections were stained for sox2 expression (red) and DAPI (blue). Dashed line indicates embryonic midline, and the lateral extent of sox2 expression is indicated by the arrowheads. Inset shows how the embryos were positioned for sectioning. (E) Total number of cells (nuclei) within the sox2 expression domain. (F–H) TUNEL staining was used to detect cell death in CoMO- (F) and MatMO2-injected embryos (G). Insets in F and G show the location of the 0.138 mm2 area on the control and injected side of each embryo scored to generate results (H). (I) RT-PCR for ncam1, tubb2b, actc1 (actin, alpha cardiac muscle 1) and H4 on animal cap explants from embryos injected into both blastomere at the 2-cell stage with CoMO, MatMO2, noggin or neurog2. Actc1 was used to confirm neural induction resulting from nog and neurog2 injection was direct (not via mesoderm induction) (Hemmati-Brivanlou and Melton, 1994). H4 was used as a loading control. Controls included RNA isolated from whole embryos and processed without (WE-RT) and with (WE) reverse transcriptase, as well as uninjected animal cap explants. Similar results were obtained from two independent experiments and when explants were cultured to the equivalent of stg 22. (J–L) Sox2 in situ hybridization on embryos injected into one ventral blastomere at the 8-cell stage with noggin (J), CoMO (K) or MatMO2 (L). The injected side is on the right (viewer’s perspective). In the graphs the error bars show the s.e.m. P-values obtained using Student’s t-test: ns, not significant; *P=0.0101; ***P<0.0001. Scale bars, (B)=100 μm; (F and J)=400 μm.

