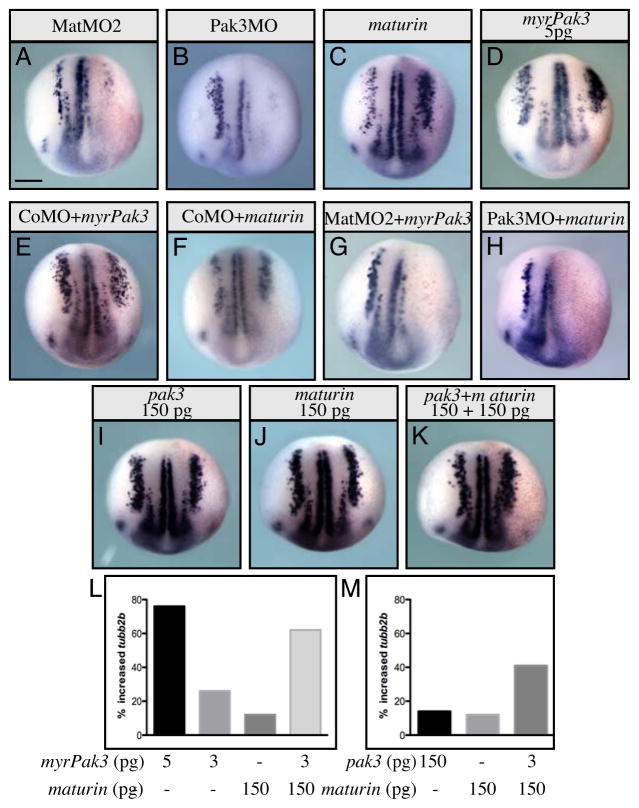
Fig. 7.
Maturin and Pak3 synergy. (A–K) Embryos were injected unilaterally into one blastomere at the 2-cell stage with the indicated morpholino(s) and/or cRNA(s). At stage 15 in situ hybridization was used to determine the effect on tubb2b expression. (L, M) Graphs illustrate the percent of embryos with additional tubb2b-positive cells in the lateral stripe, when injected with sub-maximal amounts of maturin, myrPak3, pak3 or the indicated combination of cRNAs. Scale bars, 400μm. Injected side in all embryos is right side (viewer’s perspective).

