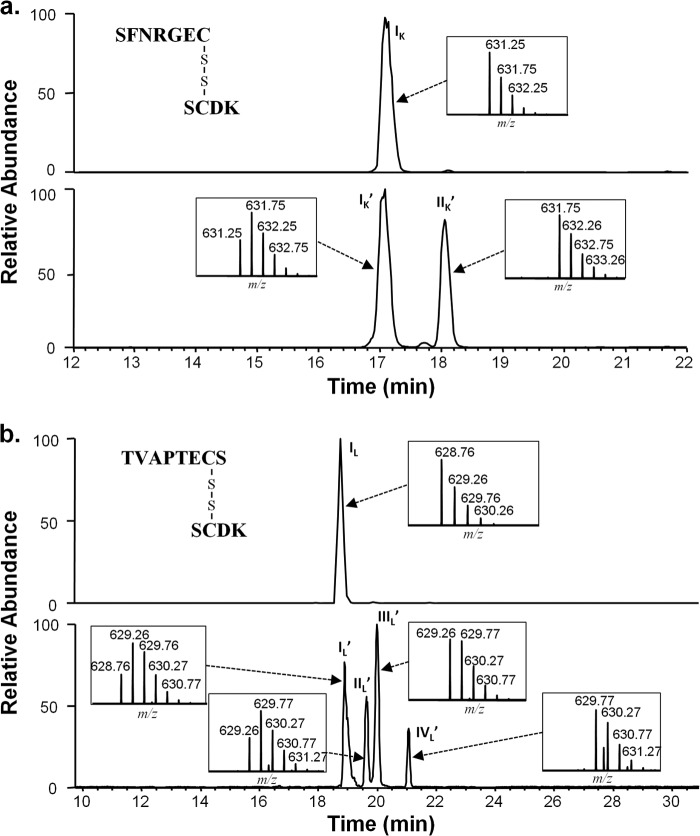
FIGURE 1.
IgG1 Lys-C generated LC-HC disulfide-linked peptides after high pH (70 h, 50 °C, pH 9.3) incubations. The peptide map is performed and run under non-reducing conditions. a, peptides from IgG1κ. The top panel is the extracted ion chromatogram (XIC) of the peptide from the sample prior to incubation. The lower panel is the peptide after incubation. Shown is the D2O incubated sample. b, peptides from IgG1λ. The top panel is the XIC of the peptide from the sample prior to incubation. The lower panel is the peptide after incubation. Shown is the D2O incubated sample. Insets show the isotopic distribution for the doubly charged species in each of the labeled peaks. The y axis of the inset figure represents relative level. Because the chromatography for the top and bottom panels was performed on different days, reference peptides (of m/z 495.76 and 990.51, Δ retention time of 2.93) were used. The subscript K designates the κ light chain, and the L designates the λ light chain. The prime symbol indicates peptides from the D2O-incubated samples.

