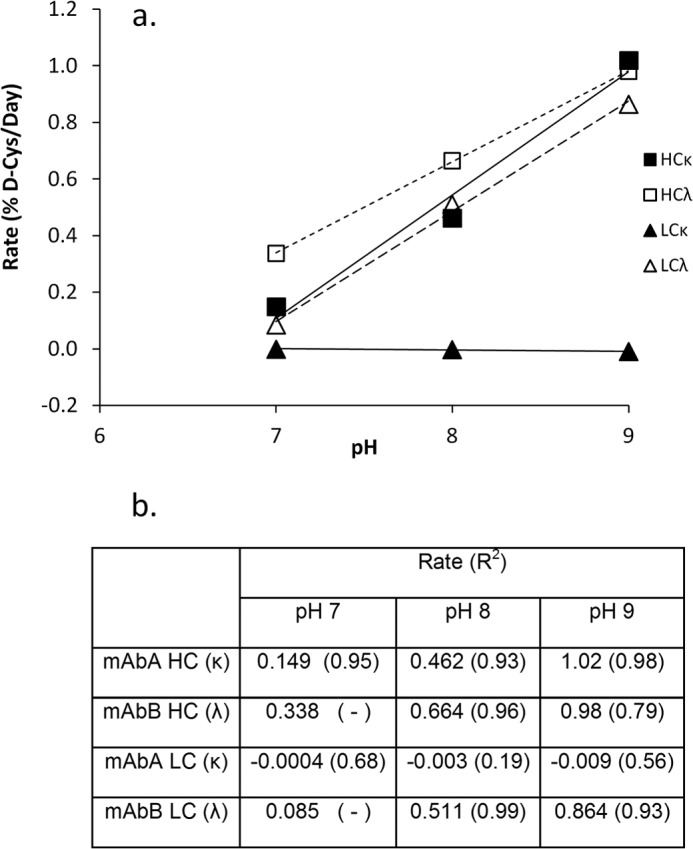
FIGURE 6.

d-Cysteine formation rates at different pH values. a, plot showing the d-cysteine formation rates at the pH values shown. Each point was calculated from a time course slope using four points for up to 30 days. For certain samples, where the correlation coefficient (R2) is not listed, only two time points were used. b, table of the calculated d-cysteine formation rates and their correlation coefficients (R2). Values are in units of % d-cysteine/day. For conditions, see “Experimental Procedures.”
