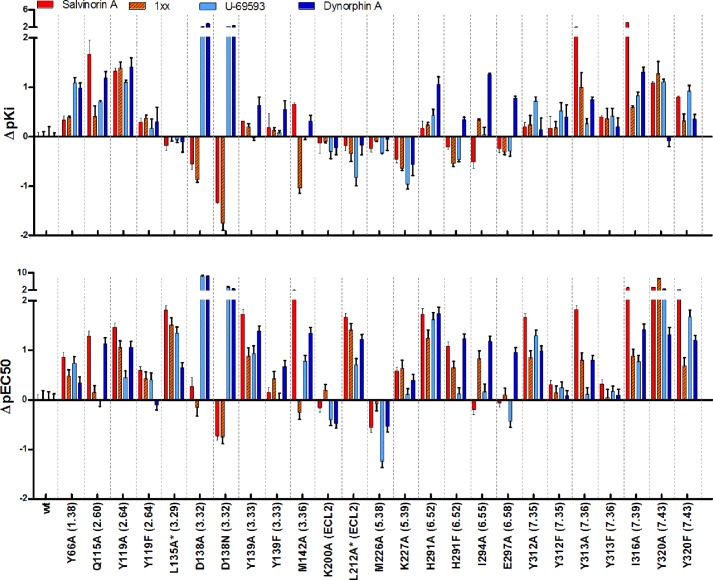
FIGURE 2.
Effect of the different mutations on binding affinity and potencies of the tested ligands. Histogram bar heights represent the difference between the KOR mutant and WT KOR potency (ΔpIC50) and affinity (ΔpKi) of the tested ligands salvinorin A (red), 1xx (red with diagonal hash marks), U-69593 (light blue), and dynorphin A (dark blue). Asterisks indicate low expressing mutants; the effect on function is at least partially due to low expression levels.

