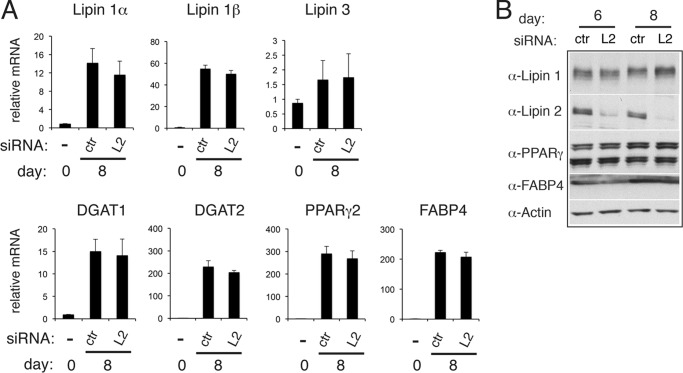
FIGURE 10.
Effects of lipin 2 down-regulation on the mRNA and protein levels of adipogenic and lipogenic markers. A, 3T3-L1 were transfected with nontargeting (control, ctr) or lipin 2 (L2) siRNA at days 4 and 6 after induction of adipogenesis. qPCR analysis was performed at days 0 and 8 of differentiation to quantify the indicated genes. The data are normalized to cyclophilin A mRNA and to control at day 0. The values are means ± S.D. of two independent experiments, and within each experiment siRNA transfections were performed in triplicate. B, extracts from cells in A were prepared at days 6 and 8 of differentiation, and 5 μg of each sample was analyzed by Western blot with the specified antibodies. The blot shown is representative of three experiments.

