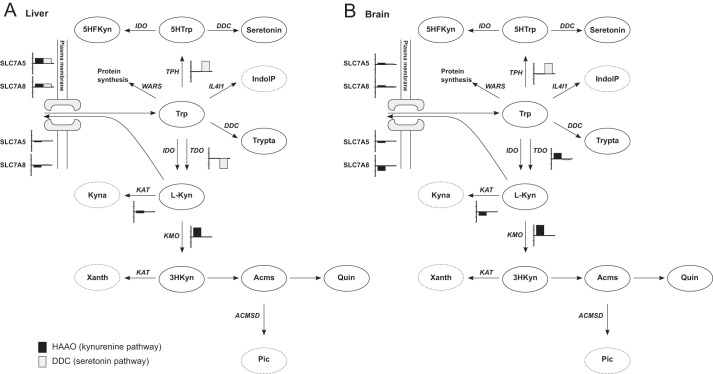
FIGURE 3.
Predicted flux control is different between liver and brain. Flux through DDC in the serotonin pathway and HAAO were used as measures of fluxes in the serotonin pathway and kynurenine pathway, respectively. A bar plot is added next to the reactions that have a control coefficient of more than +0.1 or less than −0.1. The bar is black for control of flux through HAAO (kynurenine pathway) and gray for control of flux through DDC (serotonin pathway). The interval between the tics on the y axis is 0.5. The distribution of flux control is different between human liver (A) and human brain (B). Xanth, xanthurenic acid; Acms, 2-amino-3-carboxymuconate semialdehyde; Pic, picolinic acid; 5HTrp, 5-hydroxy-tryptophan; Trypta, tryptamine; 5HFKyn, 5-hydroxy-N-formylkynurenine; IndolP, indole-pyruvate; ACMSD, 2-amino-3-carboxymuconate semialdehyde-decarboxylase; IL4I1, interleukin 4 induced 1; WARS, tryptophanyl-aminoacyl-tRNA synthetase; SLC7A5, large neutral amino acids transporter small subunit 1; SLC7A8, large neutral amino acids transporter small subunit 2.

